
Download Towards a Fair Trade State Map
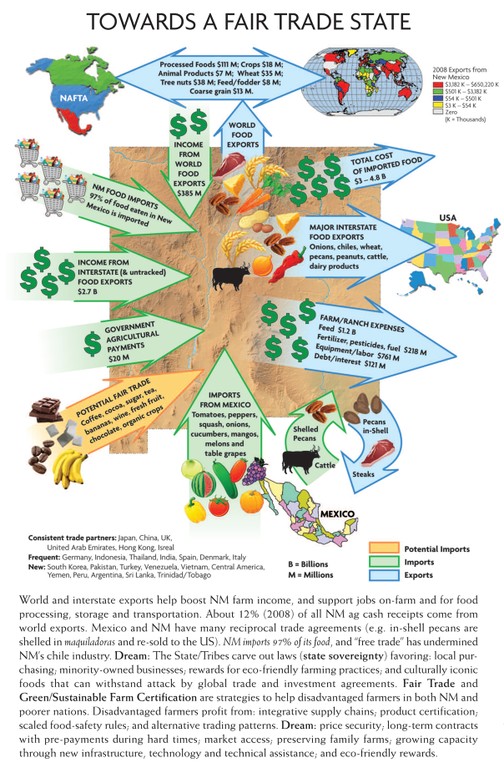
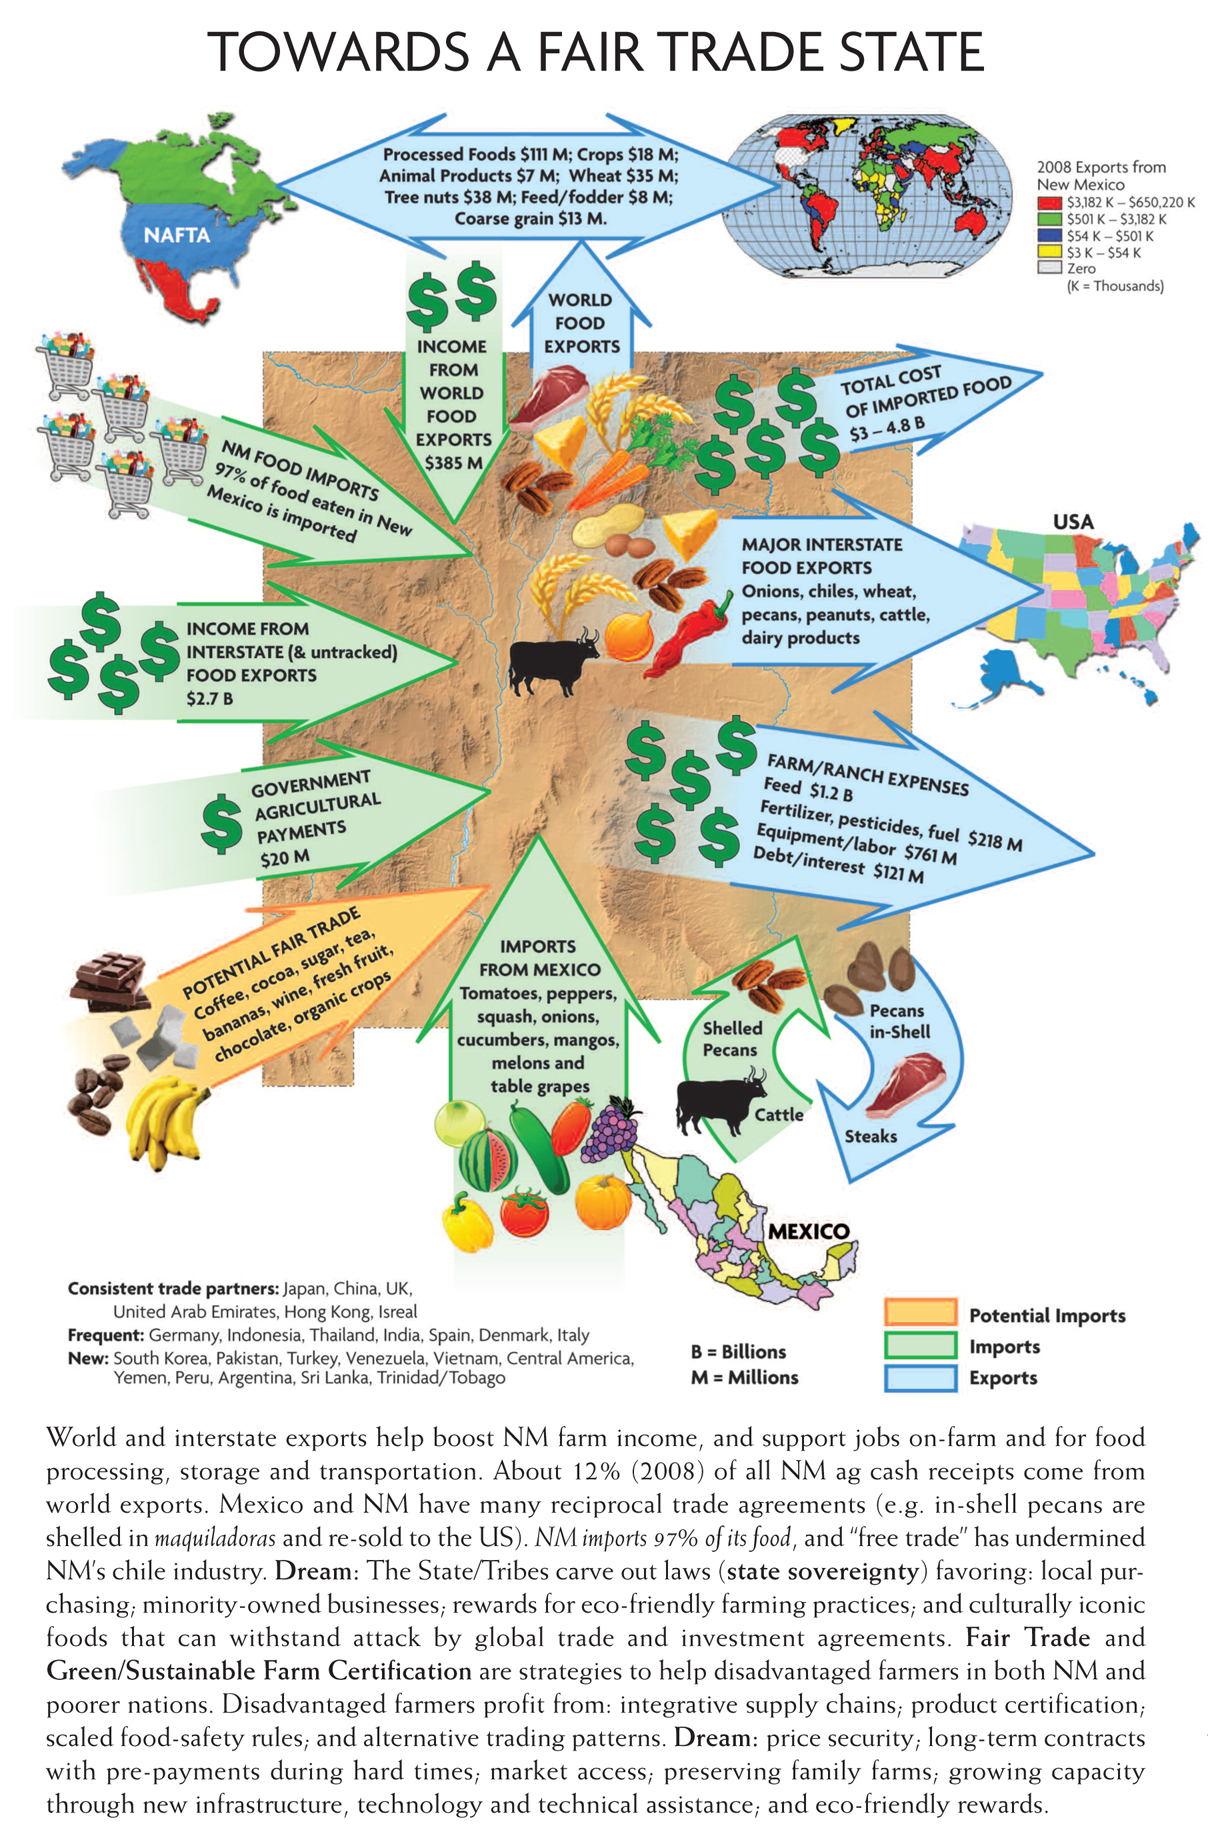
Map shows the movement of food/ food products and food-related cash in and out of the State.
At bottom: The back-and-forth trade with Mexico of beef and pecans; and the major food imports from Mexico. Most of Mexico’s organic output comes to the U.S., including New Mexico.
On lower left are: Fair Trade foods coming into New Mexico.
On left side and top left: The income and food coming into New Mexico. Income includes: government payments from Washington; income from domestic and world exports; and food consumed in New Mexico. Top and right side of map shows exports of food and expenses related to food: exports of food to world and domestic markets; money leaving the State to purchase agrochemicals, labor, and machinery and cover debt; and the total cost to consumers of imported food.
Note: New Mexico spends $5 billion on food per year that is eaten in New Mexico. Because no agency tracks cash receipts for imported food and food products, estimates for imported food vary from $3 to $4.8 billion. In short, 97% of the actual food (by volume, weight) is estimated to be imports from outside the State.