
Overview
Many more Americans are purchasing local foods. The mushrooming movement of locavores has initiated changes in demand, growing, processing, distributing, financing and selling food. Locavore consumers are finding that local food, even if it’s nominally pricier, delivers food with better value. Why?
- The food is fresher, healthier and better tasting.
- The food has a lower chance of carrying a food-borne illness such as E. coli or BSE (“mad cow” disease) and less chance of entanglement in any bioterrorism scheme.
- Local foods revitalize a sense of local pride with iconic crops such as chile, specialty cuisines, food events and ceremonies, and brands with value-added prices.
- Local food supports the community by: increasing the percentage of the food dollar that goes to the grower; keeping farms, ranches and food-related establishments from selling out; increasing local circulation of money (usually three to four times more transactions); decreasing “leakages” of food-related money and jobs; maintaining and increasing local ownerships; and increasing support of local food-security and health-care nonprofits.
- Local food can be eco-friendly food both on the farm and during processing and may nurture more green jobs.
There are two “tools” that help localize today’s global, mass-market food economy. The first provides citizens with a reasonable sense of trust and geography: the foodshed. The second provides transparency, clarifying how the food gets from farm to home plate: the value chain.
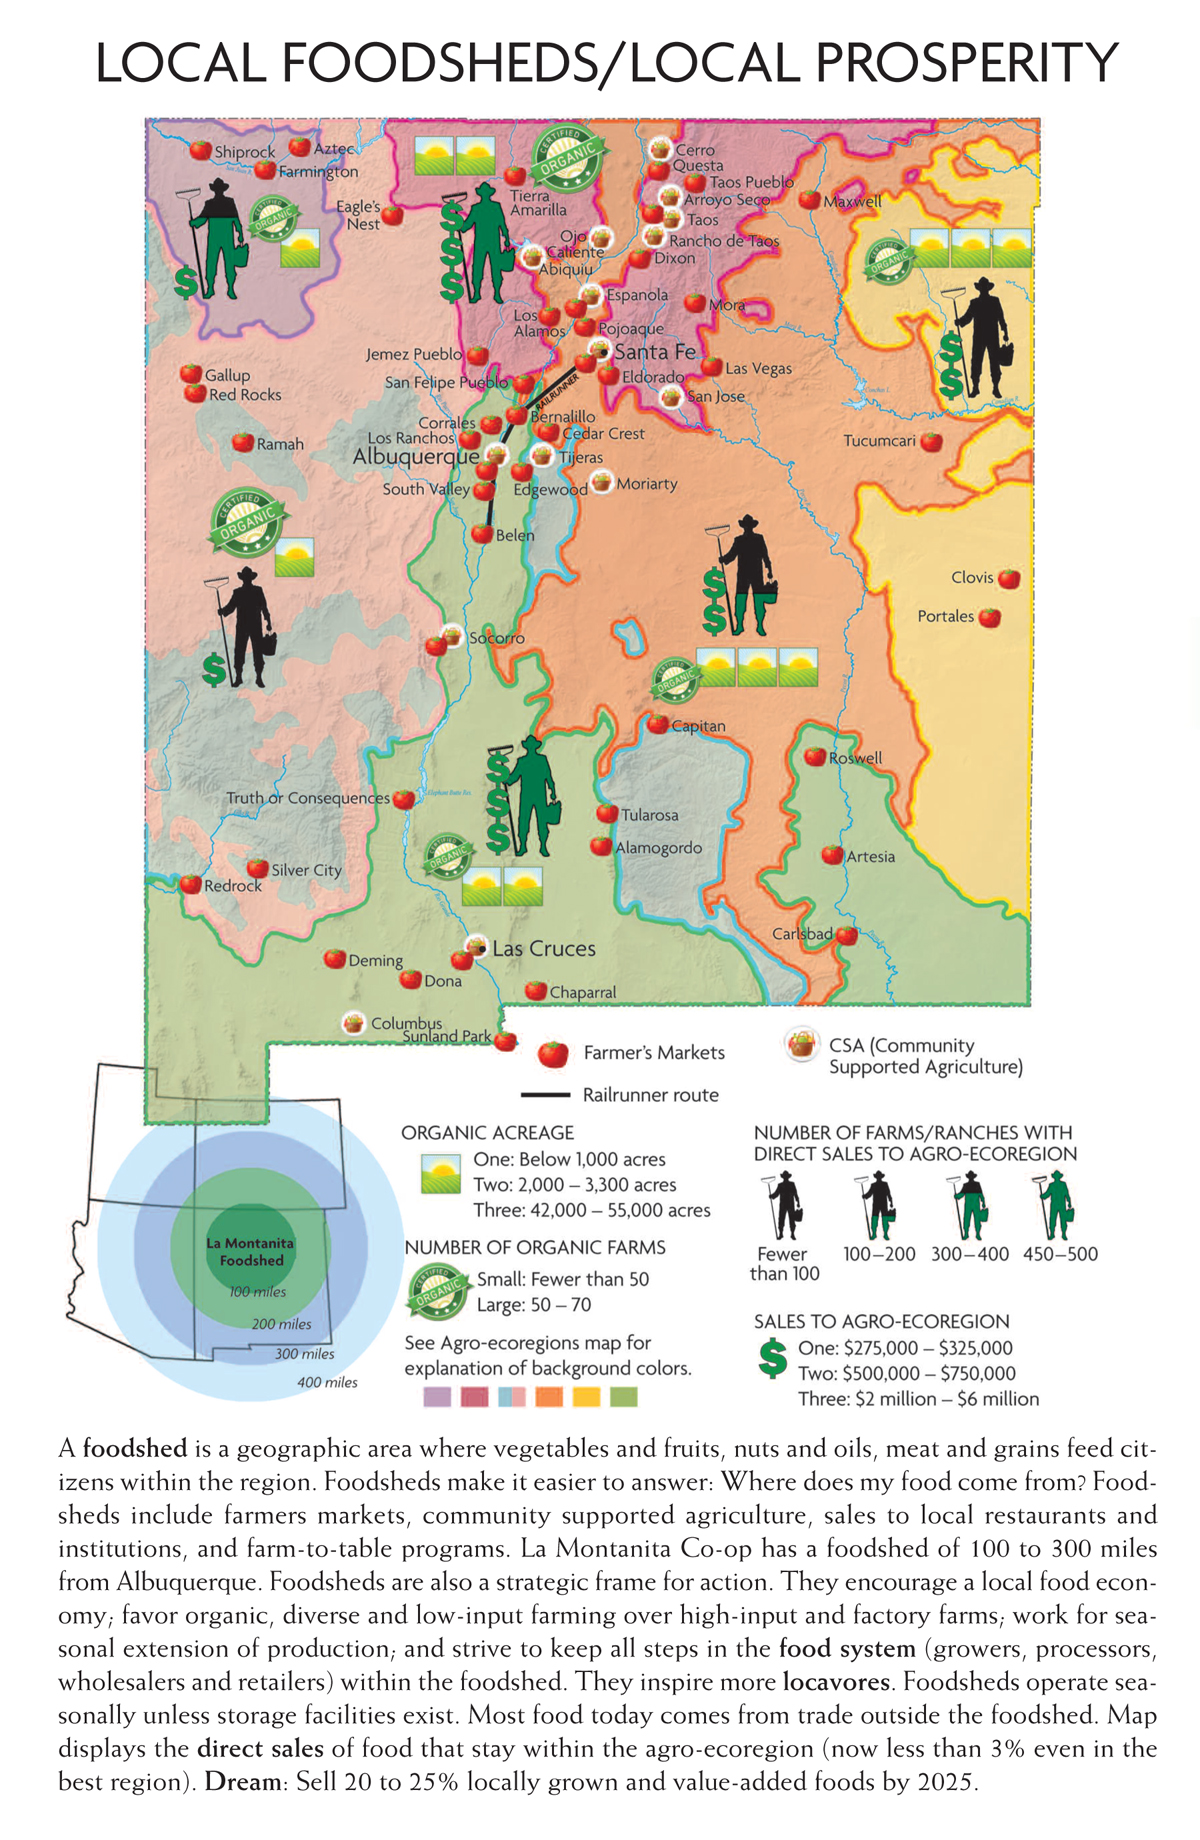
A foodshed is a geographic area where vegetables and fruits, nuts and oils, meat and grains feed citizens within the region. Foodsheds make it easier to answer: Where does my food come from? Foodsheds include farmers markets, community supported agriculture, sales to local restaurants and institutions, and farm-to-table programs. La Montanita Coop has a foodshed of 100 to 300 miles from Albuquerque.
Foodsheds are also a strategic frame for action. They encourage a local food economy, favor organic, diverse and low-input farming over high-input and factory farms, work for seasonal extension of production, and strive to keep all steps in the food system (growers, processors, wholesalers and retailers) within the foodshed. A foodshed economics is based on a moral economy: social equity, a healthier environment, community wealth and financial success. The local agrifood economy, in the dream, inspires more locavores.
The second “tool,” the value chain, is a kind of flow chart that tracks food from seed/ birth to eating It’s a “value” chain because the goal is not the lowest price or fastest convenience but the most embedded value for the food we eat. That value may include nutrition per dollar; climate change value per dollar; non-monetary celebratory values in ceremonies and food events; or the added value of more revenues circulating in the local community. Value chains provide a chart for financing a local food economy, especially building relationships among suppliers, buyers and sellers at every step of the value chain.
The foodshed and value chains can never produce 100% local food all seasons. They operate seasonally and require storage facilities to extend the time that local food remains available. New Mexico’s foodsheds can never produce some foods such as rice and chocolate and coffee. The more do-able dream for our arid State is: By 2025, 25% of the food economy comes from the New Mexico foodshed. Major challenges include: Scaling up so that more citizens can become locavores; capital for local agrifood infrastructure such as loading docks, food processors, transport vehicles; financing the change from conventional to local green agrifood markets.
Local Foodsheds/Local Prosperity Map

Download Local Foodsheds / Local Prosperity Map
Our map displays the number of farmers and/or ranchers that sell directly to the local agro-ecoregion. It shows the amount of the sales of each agro-ecoregion to markets within New Mexico. It shows the number and acreage of organic farms and ranches in each agro-ecoregion. It also shows locations of CSAs and farmer’s market in 2009. The small inset map shows the foodshed of LaMontanita, New Mexico’s co-op. Finally, the black line adjacent to the mid-Rio Grande is a potential transport of local foods. In 2009, the direct sales of food that stayed within the agro-ecoregion was less than 3% even in the best region.
![]() Value Chain Diagram
Value Chain Diagram

The value chain is a kind of flow chart that tracks food from seed/ birth to eating. It’s a “value” chain because the goal is not the lowest price or fastest convenience but the most embedded value for the food we eat. (The low price/efficiency chain is usually known as a “supply chain.”) That value may include nutrition per dollar; climate change value per dollar; non-monetary celebratory values in ceremonies and food events; or the added value of more revenues circulating in the local community. Above, we “cartoon” the value chain for a typical food. The farmers, brokers, buyers, movers, processors, manufacturers, wholesalers and retailers can all reduce costs and improve quality at their respective steps of the value chain. The eaters can all make purchasing decisions that reverberate up the value chain right to the farm or ranch. A value chain can make it easier to spot imports (materials, fertilizers, energy, food, livestock) that might have local substitutes. It also portrays all the trans- port steps that may need attention.
Every step in the value chain has strong influences from government (payments, taxes, extension services, environmental/labor and free trade rules), business practices (capital investment, debt, foreign investment, interest on loans), and non-government organizations (grants, food charity work, coop memberships, commodity/irrigation associations). There are too many interactions to depict here but the very complex inputs of government, business/finance and NGOs should be always kept in mind.